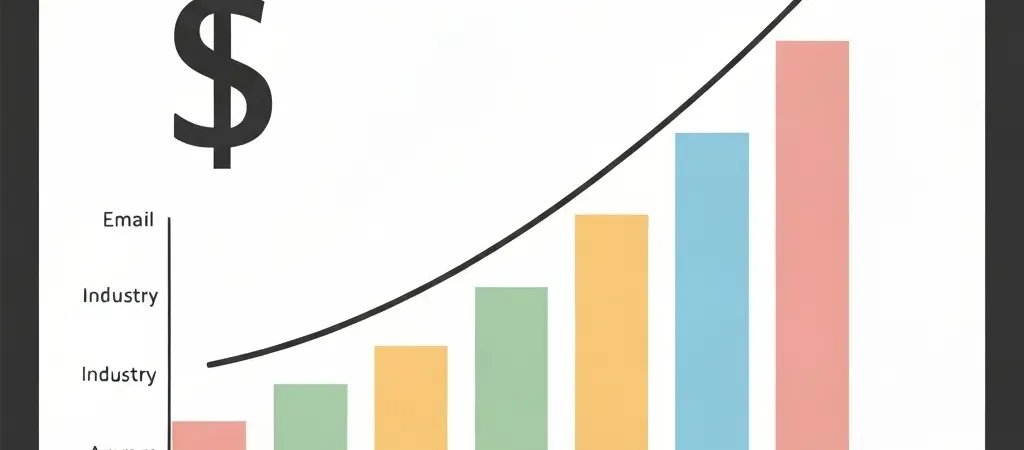
Email Marketing ROI Benchmarks by Industry 2026
Email marketing ROI benchmarks by industry matter because measuring your performance against a global average misses the point. A 22% open rate is excellent for retail and average for SaaS — comparing to the wrong benchmark leads to misguided optimization. This report compiles 2026 email marketing ROI data, open rates, click-through rates, and conversion benchmarks by industry from primary research sources including Litmus, Campaign Monitor, Klaviyo, Mailchimp, and Statista.
The headline finding: email marketing delivers an average global ROI of $36-42 per dollar spent (Litmus 2024 State of Email). But this average obscures significant industry variation — and the difference between a high-performing and low-performing email program within any industry is larger than the difference between industries.
Global Email Marketing ROI Benchmark
The most-cited global benchmarks come from Litmus’s annual State of Email report, which surveys thousands of email marketing professionals worldwide:
- Global average email ROI: $36-42 per $1 spent (Litmus 2024)
- This represents a slight decline from 2023’s $41-44 range, partially attributed to increased competition for inbox attention
- High performers (top 25% of email programs) achieve $50+ per $1 spent
- Low performers (bottom 25%) achieve under $15 per $1 spent, primarily due to poor list quality and low personalization
Methodology note: ROI figures are self-reported by email marketing professionals with revenue attribution varying by methodology. Direct attribution (tracking email clicks to purchases) vs. multi-touch attribution produces different ROI numbers. Self-reported figures skew higher than external audit findings. Use these as directional benchmarks, not precise guarantees.
ROI Benchmarks by Industry
| Industry | Average ROI per $1 | Why It’s This Level |
|---|---|---|
| E-commerce / Retail | $45 | High purchase frequency, automated cart recovery, product personalization |
| Financial Services | $40 | High LTV per customer, compliance-driven engagement |
| Travel and Hospitality | $38 | Seasonal demand, loyalty program email integration |
| Media and Publishing | $36 | Newsletter-driven subscriber monetization |
| B2B Technology / SaaS | $32 | Longer sales cycles dilute email attribution; high LTV compensates |
| Healthcare | $28 | Compliance restrictions limit personalization; strong engagement when relevant |
| Professional Services | $27 | Relationship-driven purchases reduce direct email attribution |
| Education | $25 | High decision complexity; email strong for nurture but slow to convert |
| Nonprofit | $22 | Donation conversion rates lower than commercial; high engagement |
Sources: Litmus 2024 State of Email, Klaviyo 2025 E-commerce Benchmarks, DMA / UK Data & Marketing Association, Campaign Monitor industry reports
Open Rate Benchmarks by Industry
| Industry | Average Open Rate | Benchmark Range |
|---|---|---|
| Government / Nonprofit | 28.7% | 22-35% |
| Education | 27.4% | 21-34% |
| Healthcare | 26.3% | 20-33% |
| Financial Services | 25.9% | 19-33% |
| B2B Technology / SaaS | 24.8% | 18-32% |
| Professional Services | 23.5% | 17-30% |
| Media / Publishing | 22.1% | 16-29% |
| E-commerce / Retail | 20.3% | 14-27% |
| Travel / Hospitality | 19.8% | 13-26% |
Note: Apple Mail Privacy Protection (MPP) has inflated reported open rates since 2021. Actual human-triggered open rates are typically 3-5 percentage points lower than reported figures for iOS-heavy audiences. Treat open rate as a directional metric; click rate is a more reliable engagement signal in 2026.
Click-Through Rate Benchmarks by Industry
| Industry | Average CTR | Average Click-to-Open Rate |
|---|---|---|
| E-commerce / Retail | 3.4% | 16.7% |
| B2B Technology / SaaS | 3.1% | 12.5% |
| Financial Services | 2.8% | 10.8% |
| Media / Publishing | 4.6% | 20.8% |
| Healthcare | 2.3% | 8.7% |
| Professional Services | 2.5% | 10.6% |
| Education | 2.4% | 8.8% |
| Travel / Hospitality | 2.9% | 14.6% |
Sources: Campaign Monitor 2025 Email Marketing Benchmarks, Mailchimp Industry Benchmarks 2025, Litmus 2024 State of Email
Automated vs. Broadcast Email Performance
The performance gap between automated (triggered) emails and broadcast (newsletter/campaign) emails is consistent across industries:
| Metric | Automated Emails | Broadcast Emails | Difference |
|---|---|---|---|
| Average open rate | 35-40% | 20-25% | +62% lift |
| Average CTR | 5-10% | 2-4% | +100-150% lift |
| Revenue per email sent | 24x higher | Baseline | +2,300% lift |
| Unsubscribe rate | 0.1-0.3% | 0.2-0.5% | Lower for automated |
How to Benchmark Your Own Email Performance
Use this framework to assess whether your email performance is above or below industry benchmarks:
- Identify your primary industry from the tables above
- Export your last 3 months of campaign data from your email platform — open rate, CTR, unsubscribe rate, and revenue per email if tracked
- Compare to the industry average — are you above or below the mean? By how much?
- Identify your biggest gap — open rates significantly below benchmark: focus on subject lines and deliverability; CTR below benchmark: focus on email content and CTAs
- Set quarterly improvement targets — aim to close 50% of the gap to benchmark in 90 days
The most reliable path to above-benchmark performance is implementing proper marketing automation — segmented, triggered emails consistently outperform broadcast campaigns by the margins shown above. Platforms like CampaignOS provide the automation infrastructure to move from broadcast-only sending to a behavioral, triggered email strategy. For specialized industries like academic services (where Tesify operates), benchmark ROI improves further when email addresses hyper-specific audience needs.
Frequently Asked Questions
What is a good email marketing ROI?
The global average email marketing ROI is $36-42 per $1 spent (Litmus 2024). An ROI above $36 is “good” by global standards. High-performing programs achieve $50+ per $1. The most important comparison is against your own industry benchmark — a $32 ROI in B2B SaaS is average, while the same ROI in e-commerce is below benchmark. Focus on benchmarking against your industry peers rather than the global average.
What is a good email open rate by industry?
Open rates vary significantly by industry: Government/Nonprofit averages 28.7%, Education 27.4%, Healthcare 26.3%, Financial Services 25.9%, B2B Tech/SaaS 24.8%, E-commerce 20.3%. A “good” open rate means your rate exceeds your industry benchmark. Note that Apple Mail Privacy Protection has inflated reported open rates since 2021 — click-to-open rate and click-through rate are more reliable engagement signals in 2026.
Why does email ROI vary by industry?
Email ROI varies by industry primarily due to purchase frequency, transaction value, and the role email plays in the buying journey. E-commerce has high ROI because email directly triggers frequent purchases of moderate-value items. Professional services has lower email ROI because purchases are infrequent, high-value, and relationship-driven — email contributes to the journey but rarely drives the final decision directly. Industries where email can trigger immediate action see higher measured ROI.
How does Apple Mail Privacy Protection affect email metrics?
Apple Mail Privacy Protection (MPP), introduced in iOS 15 and mail.app in macOS Monterey, pre-loads email content (including tracking pixels) when mail arrives — even if the user never opens it. This inflates reported open rates by 3-8 percentage points for lists with significant Apple Mail usage. In 2026, many email platforms filter Apple machine opens from reported rates, but not all. Use click-through rate as your primary engagement benchmark; it is not affected by MPP.
What email marketing benchmarks should I track monthly?
Track monthly: click-through rate (primary engagement signal), unsubscribe rate (list health signal; alarm if above 0.5%), list growth rate (net new subscribers minus unsubscribes), revenue per email sent (or revenue per campaign if direct attribution is available), and deliverability metrics (bounce rate under 2%, spam complaint rate under 0.1%). Compare each to your industry benchmark and your own prior period to identify trends.
Which industry has the highest email marketing ROI?
E-commerce and retail consistently reports the highest email marketing ROI at approximately $45 per $1 spent (Klaviyo 2025). This is driven by automated behavioral sequences (abandoned cart recovery, post-purchase sequences, win-back campaigns) that are directly measurable and tied to transaction data. The high purchase frequency in retail means small improvements in email conversion compound quickly into significant revenue.
How do automated emails compare to newsletter emails in ROI?
Automated triggered emails generate 24x more revenue per email sent compared to broadcast newsletter campaigns (Experian). They achieve 62% higher open rates and 100-150% higher click-through rates on average. The revenue differential comes from relevance: a triggered abandoned cart email is sent to someone who just expressed purchase intent, while a newsletter is sent to everyone on a predetermined schedule regardless of their current interest level.
Achieve Above-Benchmark Email Performance
CampaignOS provides the behavioral automation infrastructure to move your email program from broadcast-only to triggered and segmented — the approach that consistently achieves above-benchmark open rates, CTRs, and ROI across every industry.