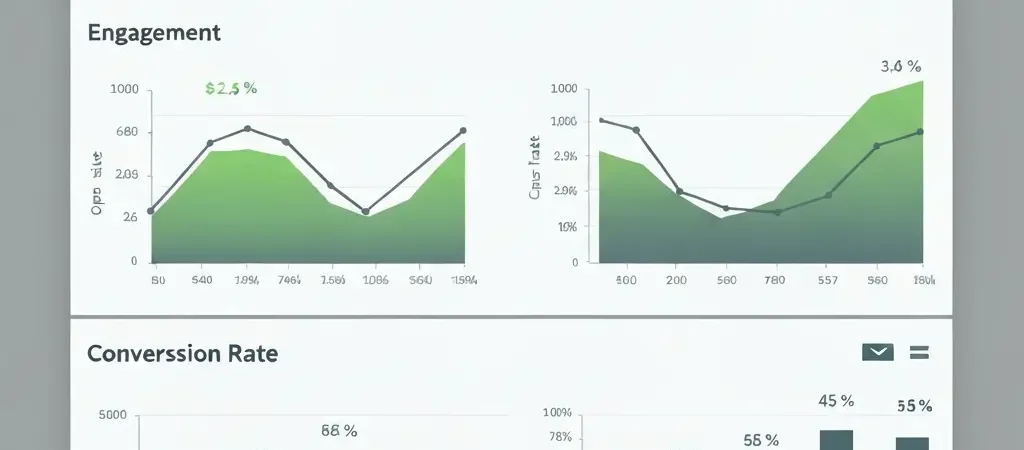
Campaign Performance Tracking: How to Measure What Actually Matters
Most marketing teams track the wrong things. They obsess over open rates while their trial conversion is declining. They celebrate high click-through rates while churn quietly accelerates. Campaign performance tracking that actually drives business improvement requires measuring outcomes, not proxies — and connecting those outcomes back to the specific campaigns and workflows that influenced them.
This tutorial walks you through setting up a practical performance tracking system for your marketing campaigns: the metrics that matter, how to measure them accurately, and how to use the data to improve campaign results over time.
Which Metrics to Track (and Why)
Tier 1: Health Metrics (Check Daily)
- Delivery rate: % of emails that reached the recipient’s server (not bounced). Target: >98%
- Hard bounce rate: % of emails that failed permanently (invalid address). Target: <2%
- Spam complaint rate: % of recipients who marked your email as spam. Target: <0.1%
If any health metric crosses its threshold, pause campaign activity and diagnose before continuing. Health problems compound — a rising bounce rate today becomes a reputation problem that affects all future campaigns.
Tier 2: Engagement Metrics (Review Weekly)
- Open rate: % of delivered emails that were opened. Note: Apple MPP (Mail Privacy Protection) inflates open rates — focus on click-to-open rate as your primary engagement indicator
- Click-to-open rate (CTOR): % of openers who clicked a link. More reliable than raw CTR since it normalizes for deliverability differences
- Unsubscribe rate: % who opted out. Monitor per campaign, not just overall — high unsubscribes on specific campaigns signal content/audience mismatch
Tier 3: Outcome Metrics (Review Monthly)
- Campaign conversion rate: % of contacts who completed the campaign’s goal action (signup, upgrade, purchase)
- Revenue per campaign: Direct revenue attributable to the campaign (requires conversion tracking integration)
- Workflow completion rate: % of contacts who entered an automation workflow and reached the success state
- Assisted conversion rate: % of conversions where a campaign was in the attribution path, even if not the last touch
Setting Up Tracking in CampaignOS
Step 1: Configure Conversion Goals
In CampaignOS, go to Settings → Conversion Goals. Define the outcomes that represent success for your campaigns: trial signup, plan upgrade, first purchase, feature activation. Each goal is tied to a specific event (which you fire from your product via the CampaignOS API or a webhook).
Step 2: Add Campaign UTM Parameters
Every outbound link in your emails should include UTM parameters to track traffic in Google Analytics or your web analytics tool:
- utm_source: campaignos (or your platform name)
- utm_medium: email
- utm_campaign: [workflow name, e.g., onboarding-sequence]
- utm_content: [email number or variant, e.g., email-3-b]
CampaignOS can append UTM parameters automatically to all links in a campaign — configure this in the campaign settings to ensure consistent attribution.
Step 3: Set Up Webhook Integration for Product Events
Send behavioral events from your product to CampaignOS via the API. Configure webhook integration: when a user activates in your product, your product fires a webhook that CampaignOS receives and records as a contact event. This event then appears in campaign attribution reports.
Step 4: Configure the Analytics Dashboard
Navigate to Analytics → Overview. Pin your primary metrics (delivery rate, open rate, conversion rate) to your dashboard home view. Set up email alerts for health metrics that cross thresholds. Schedule a weekly automated report to your email summarizing campaign performance.
Revenue Attribution
Attributing revenue to specific campaigns is complex — most conversions involve multiple touchpoints. CampaignOS supports three attribution models:
Last-touch attribution: 100% of credit goes to the last campaign the contact interacted with before converting. Simple, but undervalues awareness and nurture campaigns.
First-touch attribution: 100% of credit goes to the first campaign that captured the contact. Overvalues acquisition, undervalues conversion campaigns.
Linear attribution: Credit is distributed equally across all campaigns in the path. More balanced, captures the contribution of multi-step nurture sequences.
For most teams, linear attribution best represents the reality of multi-touch marketing. If you’re using an external CRM with revenue data, connect it to CampaignOS via API to close the loop between campaign engagement and actual revenue.
A/B Testing for Performance Improvement
Performance tracking only becomes valuable when it drives action. A/B testing is the mechanism for turning performance data into systematic improvement. See our dedicated guide on A/B testing email campaigns for the full methodology. Key principles:
- Test one variable at a time (subject line OR send time OR content, never multiple simultaneously)
- Run tests on statistically significant sample sizes (minimum 500 contacts per variant)
- Measure at the outcome level (conversion rate), not just the engagement level (open rate)
- Document results and apply learnings to all similar campaigns, not just the one tested
Building a Reporting Cadence
Tracking data without a review cadence is noise. Build this into your team’s process:
Daily (2 minutes): Check health metrics dashboard. Any threshold breaches require immediate action. If clean, move on.
Weekly (30 minutes): Review engagement metrics for all active campaigns. Flag any campaigns with open rate or CTOR more than 20% below benchmark for investigation. Note any campaigns that are performing exceptionally well — document why.
Monthly (2 hours): Full outcome metrics review. Calculate conversion rates, workflow completion rates, and revenue attribution for the month. Compare to previous month and target. Identify the single biggest opportunity for improvement and schedule the A/B test to address it.
For health-focused platforms like IQuitNow, campaign performance tracking goes beyond standard metrics to measure behavior change outcomes — tracking whether users actually quit smoking, not just whether they clicked a link. For EdTech platforms like Tesify, performance tracking connects campaign engagement to academic completion rates. This level of outcome tracking is enabled by connecting your marketing automation platform to your product data — which Authenova’s open infrastructure approach makes straightforward through open APIs.
Industry Benchmarks for 2026
| Metric | SaaS Average | E-commerce Average | Nonprofit Average |
|---|---|---|---|
| Open rate | 28–35% | 18–25% | 30–40% |
| Click-to-open rate | 12–18% | 8–15% | 14–22% |
| Unsubscribe rate | <0.4% | <0.5% | <0.3% |
| Trial conversion (behavioral) | 15–25% | N/A | N/A |
| Abandoned cart recovery | N/A | 5–15% | N/A |
Note: Behavioral trigger emails consistently outperform batch campaigns by 2–5x on all engagement metrics. If your automated sequences aren’t outperforming your broadcast benchmarks, review your trigger logic and personalization.
Track Campaigns with CampaignOS
CampaignOS includes real-time campaign analytics across all channels with conversion goal tracking, A/B test management, and automated reporting. Free and open source.
Frequently Asked Questions
What is campaign performance tracking?
Campaign performance tracking is the measurement and analysis of marketing campaign outcomes across three layers: health metrics (delivery rate, bounce rate), engagement metrics (open rate, click rate), and business outcome metrics (conversion rate, revenue attribution). Effective tracking connects engagement data to real business results, enabling data-driven optimization of your marketing campaigns.
Why is open rate no longer a reliable metric?
Apple’s Mail Privacy Protection (MPP), introduced in 2021, automatically “opens” emails on behalf of users before they read them, inflating open rates. By 2026, a significant portion of email opens are generated by email clients and security scanners, not actual human readers. Click-to-open rate (CTOR) — clicks divided by opens — is a more reliable engagement indicator because it requires both an actual human open and a click action.
How do I track email campaign conversions?
Track conversions by: (1) adding UTM parameters to all email links to track traffic in Google Analytics; (2) setting up conversion goals in CampaignOS tied to specific behavioral events from your product; (3) firing webhook events from your product back to CampaignOS when a contact completes a goal action. Combining these three approaches gives you both web analytics attribution and marketing platform attribution.
What’s a good email campaign conversion rate?
It depends heavily on the action being measured and the email type. For behavioral trigger emails (abandoned cart, activation nudge), conversion rates of 5–15% are achievable. For batch broadcast emails promoting a product offer, 0.5–3% is typical. For re-engagement sequences, 2–8% win-back rate is the norm. The key is to track your own baseline and measure improvement over time rather than chasing industry averages.