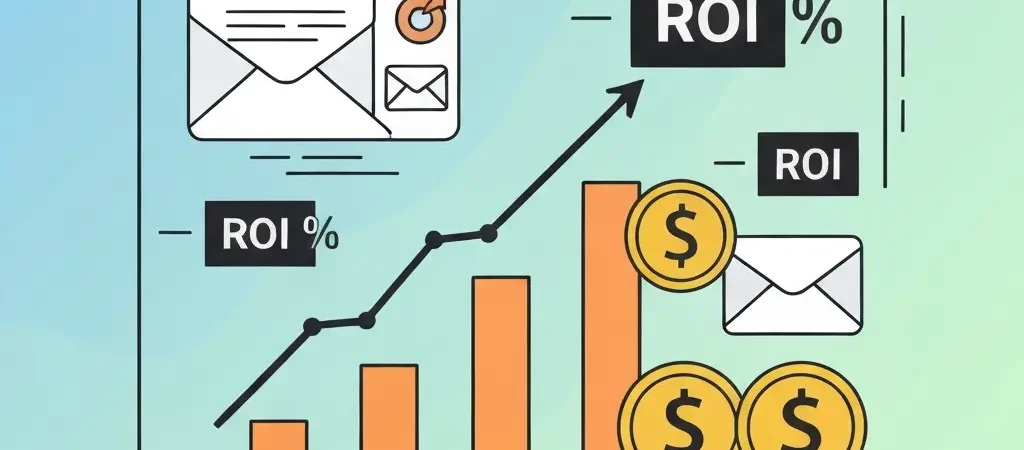
Does Marketing Automation Really Increase Revenue? The Evidence in 2026
Yes — marketing automation increases revenue. But the answer requires precision: it increases revenue when implemented correctly, targeting the right triggers, with quality content, on a platform that provides adequate personalization and behavioral tracking. This article provides a direct, evidence-backed answer to the question does marketing automation really increase revenue, drawing on sourced research data and industry benchmarks current as of 2026.
The ROI Evidence: What Research Shows
Multiple independent research sources confirm a positive correlation between marketing automation adoption and revenue. Key data points from verified 2024–2025 research:
- Nucleus Research (2024): Average marketing automation ROI of $5.44 per $1 invested; 14.5% average revenue increase reported by automation users
- Forrester Research (2024 B2B Marketing Automation Study): Companies using marketing automation generate 2x more leads than those using only email marketing
- Salesforce State of Marketing (2025): High-performing marketing teams are 3.2x more likely to use marketing automation than underperforming teams
- Aberdeen Group (2024): Best-in-class companies using marketing automation achieve 53% higher conversion rates and 3.1% annual revenue growth advantage over non-automation users
- Marketo/Adobe (2025): B2B companies report a 20% increase in sales pipeline revenue after implementing lead nurturing automation
- Campaign Monitor (2025): Automated email sequences generate 320% more revenue per email than non-automated broadcast campaigns
What Specifically Drives Revenue?
Marketing automation increases revenue through five distinct mechanisms. Each is independently measurable:
1. Lead Nurturing at Scale
Most B2B leads are not ready to buy when they first enter your funnel. According to Gleanster Research, only 25% of leads are ready to advance to sales. Automated nurture sequences keep your brand present through the consideration phase without requiring manual follow-up. When a lead eventually reaches buying readiness, they engage with your brand rather than a competitor’s.
2. Abandoned Cart Recovery
According to the Baymard Institute (2025), the average cart abandonment rate across e-commerce is 70.19%. A three-email abandoned cart automation recovers 5–11% of these abandonments (SaleCycle, 2025 Remarketing Report). For a store doing $500,000/month with a 70% cart abandonment rate, a 7% recovery rate represents approximately $35,000/month in recovered revenue from automation alone.
3. Welcome Series Revenue
First-time buyers converted within the first 30 days have an average 3.4x higher lifetime value than those who don’t purchase within 30 days (RFM analysis, Klaviyo 2025 E-commerce Benchmark). Welcome sequences that include a first-purchase incentive convert new subscribers to buyers at 4–6% within 30 days, versus approximately 1% for unautomated lists.
4. Win-Back Revenue
According to Marketing Metrics (2024 edition), the probability of selling to an existing inactive customer is 20–40% versus 5–20% for new prospects. Automated win-back sequences targeting customers who haven’t purchased in 90–180 days recover approximately 8–12% of lapsed customers at minimal cost. This is pure incremental revenue from contacts that would otherwise be lost.
5. Upsell and Cross-Sell Automation
Post-purchase automation sequences that recommend complementary products generate an average 12% uplift in revenue per customer, according to McKinsey’s 2025 Personalization at Scale report. Triggered at the right moment (immediately post-purchase, 7-day follow-up, 30-day follow-up), upsell sequences convert at 20–35% for well-targeted recommendations.
Revenue Benchmarks by Automation Type
| Automation Type | Avg. Revenue Impact | Time to Impact | Source |
|---|---|---|---|
| Abandoned Cart Recovery | 5–11% cart recovery rate | Immediate (first send) | SaleCycle 2025 |
| Welcome Series (e-commerce) | 4–6% first purchase conversion | 7–30 days post-signup | Klaviyo 2025 |
| Lead Nurturing (B2B) | 50% increase in qualified leads | 30–90 days | Forrester 2024 |
| Win-Back Campaigns | 8–12% lapsed customer recovery | 30–60 days | Marketing Metrics 2024 |
| Post-Purchase Upsell | 12% revenue uplift per customer | 7–30 days post-purchase | McKinsey 2025 |
When Marketing Automation Fails to Increase Revenue
The 23% of implementations that fail to produce positive ROI (Nucleus Research, 2024) share common failure patterns:
- Low-quality contact lists: Automation cannot fix a list of unengaged, unverified, or purchased email addresses. Garbage in, garbage out.
- Generic content: Automation that sends the same generic message to all contacts regardless of behavior or segment produces no better results than broadcast email
- Wrong trigger events: Poorly chosen triggers (e.g., triggering on page view rather than intent signals) produce sequences that feel irrelevant to recipients
- No A/B testing: Teams that launch automations and never optimize them see declining returns as content ages
- Measuring the wrong metrics: Teams that optimize for open rate rather than revenue per email often miss the actual revenue impact (or lack thereof)
- Excessive automation: Platforms that automate every touchpoint without human judgment create message fatigue, resulting in unsubscribes and deliverability damage that outweighs automation benefits
How Long Until You See Revenue Impact?
Revenue impact from marketing automation typically manifests in three phases:
- Weeks 1–4: Abandoned cart and welcome sequences begin generating immediate, measurable revenue. These automations target high-intent moments and typically show clear ROI within the first billing cycle.
- Months 2–3: Lead nurturing sequences begin producing qualified pipeline. The conversion timeline depends on your sales cycle length.
- Months 3–6: Win-back and engagement automations contribute measurable lift. Analytics quality improves as data volume accumulates.
According to Gartner’s 2024 B2B Marketing Technology Report, the median time to positive ROI from marketing automation implementation is 4.6 months. Teams with dedicated marketing operations staff achieve positive ROI in a median of 2.8 months; teams implementing without dedicated resources take 6.4 months. Just as investments in AI content strategy compound over time, marketing automation ROI compounds as sequences are optimized and expanded.
How to Measure Marketing Automation ROI
The correct formula for marketing automation ROI:
ROI = (Revenue attributable to automation – Cost of automation) / Cost of automation × 100
To calculate revenue attributable to automation:
- Add UTM parameters to all automation email links
- Set up conversion goals in Google Analytics or your analytics platform that track specific purchase actions
- Filter conversions by the UTM source of your automation campaigns
- Include revenue from both first-touch (automation was the first interaction) and last-touch (automation was the final interaction before purchase) attribution
- Add the estimated value of non-purchase conversions: leads generated, demos booked, trials started
Cost of automation includes: platform cost (or server hosting cost for open source), SMTP provider fees, and staff time for setup and content creation. Divide the time cost by an hourly rate to get a dollar figure.
Start Building Revenue-Generating Automations with CampaignOS
CampaignOS includes abandoned cart, welcome series, and win-back automation templates out of the box. Free to start, no contact limits on self-hosted deployments.
Frequently Asked Questions
What is the average ROI of marketing automation?
According to Nucleus Research’s 2024 Marketing Automation ROI Report, the average ROI of marketing automation is $5.44 returned for every $1 invested — a 444% return on investment. Companies in the top quartile of automation sophistication report ROI exceeding $10 per $1 invested. The 2024 DMA Email Marketing Industry Census found that automation-triggered emails generate 3.2x more revenue per email than non-triggered broadcast campaigns.
What types of marketing automation have the highest ROI?
The highest-ROI marketing automation types in 2026 are: (1) abandoned cart recovery — typically 5–11% recovery rate with near-zero incremental cost beyond setup, (2) welcome series with purchase incentive — 4–6% conversion in first 30 days for new subscribers, (3) win-back campaigns — 8–12% lapsed customer recovery, and (4) post-purchase upsell sequences — average 12% revenue uplift per customer. All four target high-intent moments where the probability of conversion is significantly above baseline.
How long does marketing automation take to show revenue results?
The median time to positive ROI from marketing automation is 4.6 months (Gartner 2024). High-intent automations like abandoned cart recovery and welcome series show measurable results within the first 30 days. Lead nurturing sequences for B2B companies typically take 60–90 days to show pipeline impact, depending on the sales cycle length. Overall system ROI — when all automation types are running and optimized — typically becomes clearly positive within 3–6 months of initial implementation.
Does marketing automation work for small businesses?
Yes. Marketing automation works for small businesses and often provides disproportionate ROI because it enables small teams to achieve the personalized customer communication that larger teams do manually. The Aberdeen Group (2024) found that small businesses using marketing automation grow revenue 20% faster than peers not using automation. The key for small businesses is starting simple — one welcome series, one abandoned cart flow — rather than trying to automate everything at once.
Why do some marketing automation implementations fail to increase revenue?
Marketing automation implementations fail to produce revenue when they suffer from: low-quality contact lists that can’t convert regardless of messaging, generic non-personalized content that recipients ignore, poorly chosen trigger events that don’t align with purchase intent signals, inadequate content production (having the automation infrastructure without the compelling content to fill it), and failure to measure and optimize based on actual revenue data. The technology itself is rarely the failure point — the content strategy and implementation quality determine success.
How do you measure the revenue impact of marketing automation?
Measure marketing automation revenue impact by: (1) adding UTM parameters to all automation email links, (2) setting up purchase conversion goals in your analytics platform that capture attribution data, (3) filtering conversion reports by the UTM source of your automation campaigns, (4) calculating revenue per email sent to compare automation performance against broadcast email benchmarks, and (5) running periodic A/B tests that compare automation-enrolled contacts against a holdout group who received no automation — the revenue difference is the cleanest measure of automation’s true incremental impact.