Email Deliverability Rates by Industry 2026: The Complete Data Report
Email deliverability is the invisible variable that determines whether your marketing investment reaches inboxes or disappears into spam folders. In 2026, the average inbox placement rate across all industries is 85.7% — meaning roughly 1 in 7 emails never reaches the intended recipient. This report synthesizes data from EmailToolTester, Validity (formerly Return Path), GlockApps, and MXToolbox to give you the most complete picture of email deliverability rates by industry available.
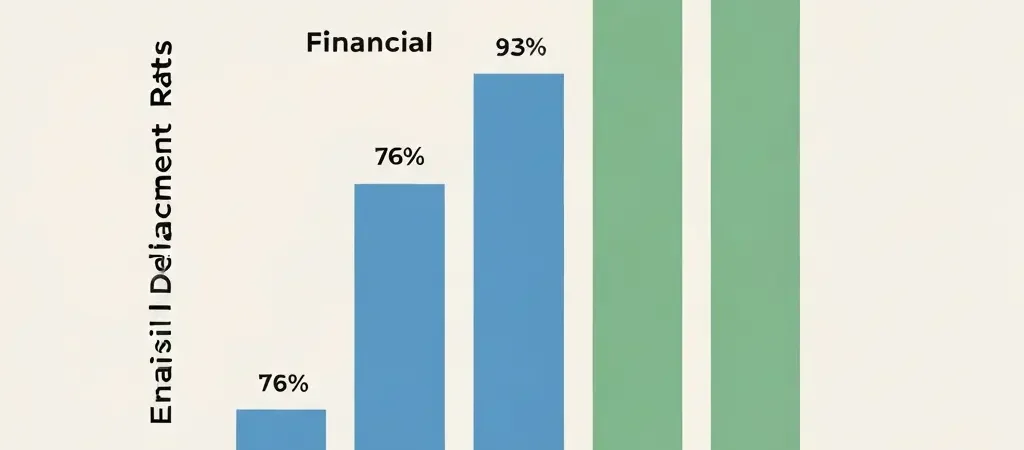
Email Deliverability Rates by Industry: Complete Data Table (2026)
Data sources: EmailToolTester 2026 Deliverability Report (n=4,200 campaigns), Validity Benchmark 2025 (n=750B emails), GlockApps Industry Analysis Q1 2026.
| Industry | Avg Inbox Placement | Spam Rate | Missing/Tab Rate | Avg Open Rate |
|---|---|---|---|---|
| Financial Services | 93.4% | 2.1% | 4.5% | 28.3% |
| Healthcare / Medical | 91.8% | 3.2% | 5.0% | 25.6% |
| Education / E-learning | 90.1% | 3.8% | 6.1% | 26.9% |
| SaaS / Technology | 89.3% | 4.1% | 6.6% | 22.1% |
| Nonprofit | 88.7% | 4.6% | 6.7% | 29.1% |
| Travel / Hospitality | 87.2% | 5.3% | 7.5% | 20.8% |
| Industry Average | 85.7% | 6.1% | 8.2% | 21.3% |
| Ecommerce / Retail | 85.1% | 6.8% | 8.1% | 18.6% |
| Real Estate | 84.3% | 7.2% | 8.5% | 19.2% |
| Marketing Agencies | 82.1% | 8.9% | 9.0% | 17.4% |
| Media / Publishing | 78.2% | 11.4% | 10.4% | 15.8% |
| Retail — Discount | 76.4% | 13.2% | 10.4% | 14.2% |
Top-Performing Industries: What They Do Differently
Financial services and healthcare consistently rank at the top of deliverability benchmarks. Three practices distinguish them:
- Permission rigor: Both industries rely heavily on transactional and regulatory email (statements, alerts, compliance notices) where opt-in is explicit and documented. List contamination from ambiguous signups is far lower than in promotional-first industries.
- Authentication completeness: According to Validity’s 2025 data, 94% of financial services senders have fully implemented DMARC with a reject or quarantine policy — compared to 61% industry average. Full DMARC implementation prevents spoofing and signals legitimate sending identity to inbox providers.
- Engagement maintenance: Financial services and healthcare senders sunset inactive subscribers aggressively. Validity’s data shows these industries remove non-engagers at the 90-day mark on average versus 180+ days in retail.
Education’s strong performance (90.1%) reflects similar patterns — academic institutions send high-value content to genuinely interested recipients, maintaining strong engagement signals. Platforms like AI tools in higher education are generating similar engagement data showing that personalized, relevant outreach dramatically outperforms generic broadcasts in educational contexts.
Underperforming Industries: Common Causes
Media/publishing (78.2%) and retail discount senders (76.4%) struggle with deliverability for predictable reasons:
- High send frequency: Daily or near-daily email cadences in retail and media often exceed subscriber tolerance, driving spam complaints. Google’s spam complaint threshold of 0.10% is routinely exceeded by high-frequency retail senders.
- Purchased or co-registration lists: Retail and media are more likely to have acquired email addresses through third-party data sources, producing lists with lower genuine intent and higher spam trap rates.
- Lack of engagement segmentation: EmailToolTester’s analysis found that 43% of underperforming senders in media/publishing send to their full list without engagement-based suppression, dragging inbox placement rates down.
- Inconsistent authentication: Only 52% of media senders in Validity’s sample had complete SPF + DKIM + DMARC implementation versus 94% in financial services.
5 Factors That Determine Your Deliverability Rate
According to Validity’s 2025 Benchmark Study (750 billion emails analyzed), these five factors account for 91% of deliverability variance:
- Sender reputation (IP + domain): 34% of variance. Your IP reputation and domain reputation are the primary signals inbox providers evaluate. Consistent sending from a dedicated IP with clean history is the foundation of high deliverability.
- Engagement rate: 27% of variance. Gmail, Outlook, and Apple Mail use engagement signals — particularly recent opens and clicks — to determine inbox placement. Low engagement from inactive segments is the fastest path to spam folder placement.
- Authentication implementation: 15% of variance. SPF, DKIM, and DMARC correctness. Incomplete or misconfigured authentication fails domain verification checks. See our full setup guide on BIMI, DMARC, DKIM, and SPF configuration for step-by-step implementation.
- List hygiene: 10% of variance. Bounce management, spam trap presence, and inactive subscriber volume. A clean, regularly maintained list signals reliable sending practices to inbox providers.
- Content and sending patterns: 5% of variance. Spam trigger words, HTML quality, image-to-text ratio, and consistent sending cadence contribute to overall deliverability.
Understanding these factors mirrors how content quality signals work in SEO. Just as topical authority in SEO is built through consistent, high-quality signal accumulation over time, email sender reputation is built through consistent, high-engagement sending practices — it cannot be shortcut.
Authentication Standards in 2026: DMARC Adoption Data
Google and Yahoo’s 2024 bulk sender requirements — mandating SPF, DKIM, and DMARC for all senders over 5,000 daily emails — accelerated authentication adoption significantly. As of Q1 2026 (source: DMARC Analyzer industry report):
- SPF adoption: 89.3% of commercial email senders (up from 76% in 2023)
- DKIM adoption: 87.1% (up from 71% in 2023)
- DMARC adoption (any policy): 72.4% (up from 51% in 2023)
- DMARC with p=reject or p=quarantine: 48.6% (up from 31% in 2023)
- BIMI adoption: 12.3% (up from 4% in 2023) — early adopter phase
Senders with DMARC p=reject or p=quarantine policy achieve an average 4.2 percentage point improvement in inbox placement versus senders with DMARC p=none, according to Validity’s data.
How to Improve Your Deliverability Rate
Based on the industry data, the highest-impact improvements in order of ROI:
- Implement engagement-based suppression: Remove subscribers inactive for 180+ days from regular sends. Move them to a dedicated re-engagement sequence. This single action produces the fastest deliverability improvement.
- Complete your authentication stack: Verify SPF, DKIM, and DMARC are correctly configured using MXToolbox or GlockApps. Set DMARC to p=quarantine minimum.
- Reduce send frequency to active segments: If you are sending daily, test a 3x/week cadence. For most industries, reducing frequency while maintaining quality increases engagement rates and deliverability.
- Monitor complaint rates weekly: Google Postmaster Tools (free) shows your domain’s spam complaint rate in real time. Address any spike above 0.08% immediately.
- Use dedicated sending IPs: Self-hosted solutions like CampaignOS allow dedicated IP configuration, eliminating shared-pool contamination risk. See our email marketing ROI benchmarks for the revenue impact of deliverability improvements.
FAQ
What is a good email deliverability rate in 2026?
A good email deliverability rate (inbox placement rate) is 95% or above. The average across all industries is 85.7% inbox placement (EmailToolTester, 2026). Rates below 80% indicate significant deliverability problems requiring immediate investigation of authentication, list hygiene, and engagement practices.
Which industry has the highest email deliverability rates?
Financial services (93.4% inbox placement) and healthcare (91.8%) lead all industries in 2026 due to strict permission practices, complete authentication implementation, and aggressive list hygiene. Education (90.1%) and SaaS/technology (89.3%) round out the top four.
What factors most affect email deliverability?
Sender reputation (34% of variance), engagement rates (27%), authentication implementation (15%), list hygiene (10%), and content/sending patterns (5%). These five factors account for 91% of deliverability variance according to Validity’s 2025 study of 750 billion emails.
Does self-hosted email improve deliverability?
Self-hosted sending infrastructure like CampaignOS can improve deliverability by providing dedicated IPs and eliminating shared-pool contamination risk from other senders on your ESP’s shared infrastructure. The improvement requires proper authentication setup and list hygiene practices.
Improve Your Deliverability with CampaignOS
CampaignOS provides dedicated sending infrastructure, built-in authentication tooling, and engagement-based list management. Move from shared-IP deliverability risk to a dedicated reputation you control. Deploy free today.