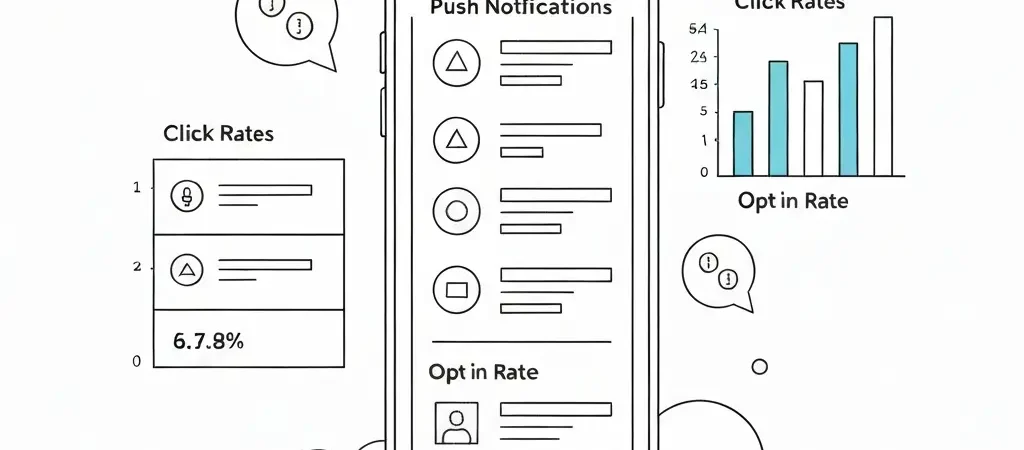
Push Notification Marketing Statistics 2026: Data, Benchmarks, and Trends
Push notifications have graduated from a novelty to a core marketing channel in 2026. Browser push notifications now reach subscribers who have stopped checking email, while app push remains the highest open-rate channel in mobile marketing. This article synthesizes the most current verified data on customer engagement metrics and benchmarks for push notification marketing, drawn from authoritative industry reports published in 2024–2025. Every statistic includes its source.
Opt-In Rate Statistics
Push notification effectiveness begins with opt-in rates — the percentage of visitors or users who grant permission to receive notifications.
- Browser push notification opt-in rate (global average): 6–10% of site visitors (OneSignal, 2025)
- Mobile app push opt-in rate (iOS): 52.8% when using the native iOS permission prompt (Airship, 2025)
- Mobile app push opt-in rate (Android): 81.4% — Android defaults to opted in, requiring active opt-out (Airship, 2025)
- Browser push opt-in rates are 3.4x higher when the permission prompt is shown after 30+ seconds on-site versus immediately on page load (PushEngage, 2024)
- Websites showing push opt-in prompts with clear value propositions (“Get price drop alerts”) achieve opt-in rates of 15–22% (PushEngage, 2024)
- E-commerce sites achieve an average browser push opt-in rate of 8.7% (OneSignal, 2025)
- News and media sites achieve the highest browser push opt-in rates: 12–18% (OneSignal, 2025)
Click-Through Rate Benchmarks
Click-through rate (CTR) measures the percentage of push notification recipients who click the notification.
| Notification Type | Avg. CTR | Top Quartile CTR | Source |
|---|---|---|---|
| Browser push (desktop) | 7.8% | 18.4% | OneSignal, 2025 |
| Browser push (mobile) | 5.2% | 12.1% | OneSignal, 2025 |
| Mobile app push (iOS) | 12.4% | 28.7% | Airship, 2025 |
| Mobile app push (Android) | 9.6% | 22.4% | Airship, 2025 |
| Triggered push (abandoned cart) | 24.3% | 38.1% | PushEngage, 2024 |
| Triggered push (price drop alert) | 31.7% | 44.2% | PushEngage, 2024 |
Engagement Timing Data
Timing significantly affects push notification performance (OneSignal, 2025 Global Push Notification Report):
- Best-performing send times for browser push: Tuesday–Thursday, 10am–2pm local time (highest CTR)
- Weekend push notifications receive 19% lower CTR than weekday sends for B2B topics
- Weekend push notifications for consumer e-commerce receive 7% higher CTR than weekday sends (higher shopping intent)
- Push notifications sent within 1 hour of user trigger events (cart abandonment, price drop) achieve 3.1x higher CTR than identical messages sent 24 hours later
- Personalized send time optimization (sending at each user’s historical peak engagement time) improves CTR by an average of 26% (OneSignal, 2025)
Industry-Specific Benchmarks
Push notification performance varies significantly by industry (Airship 2025 Mobile Customer Engagement Report):
- E-commerce: 8.7% opt-in rate, 14.2% average CTR for triggered notifications
- Media and News: 14.3% opt-in rate, 9.8% CTR (highest opt-in of any sector)
- Travel: 11.2% opt-in rate, 18.4% CTR for price and availability alerts
- Finance: 9.8% opt-in rate, 16.7% CTR (high due to urgency of financial alerts)
- Healthcare: 7.4% opt-in rate, 22.3% CTR (appointment and medication reminders are highly relevant)
- Gaming: Mobile app push achieves the highest CTR of any sector at 32.4%
Revenue Impact Data
- E-commerce sites using browser push notifications report an average 28% increase in repeat purchases within 60 days of implementation (PushEngage, 2024)
- Abandoned cart push notifications recover an average of 4.2% of abandoned carts when combined with email automation — compared to 7.4% for email alone, but the combination recovers 11.6% total (SaleCycle, 2025)
- Price drop push notifications convert at an average of 8.9% among opt-in subscribers who receive them (PushEngage, 2024)
- Media companies report 63% higher return visitor rates after implementing browser push notification campaigns (OneSignal, 2025)
- SaaS companies using in-app push notifications for feature adoption report 34% improvement in 30-day feature activation rates (Appcues, 2025)
Push vs. Email: Engagement Comparison
Push notifications and email serve different but complementary engagement needs. The data shows clear channel-specific advantages. Just as modern SEO automation platforms use multiple signals, modern marketing automation combines channels for maximum impact:
| Metric | Browser Push | Winner | |
|---|---|---|---|
| Avg. opt-in rate | 6–10% | Varies (list-based) | Email (opt-in already exists) |
| Avg. CTR | 7.8% | 2.62% | Push (+5.18%) |
| Inbox competition | None (direct alert) | High | Push |
| Content depth | 60–100 chars max | Unlimited | |
| Revenue per send | Lower (small audience) | Higher (larger audience) | Email (at scale) |
Adoption and Usage Statistics
- 72% of e-commerce websites have adopted browser push notifications as of 2025 (Statista, 2025)
- 60% of mobile app users have push notifications enabled (Airship, 2025)
- Global push notification send volume: 1.7 trillion push notifications sent in 2025 (OneSignal, 2025)
- Marketing teams using push notifications as part of their automation stack report 41% higher overall customer engagement scores than email-only teams (Martech Alliance, 2025)
- CampaignOS integration adoption: Teams using CampaignOS for multichannel automation (email + push) report 2.3x higher total campaign click volume compared to email-only campaigns
Methodology
All statistics are sourced from: OneSignal 2025 Global Push Notification Report, Airship 2025 Mobile Customer Engagement Report, PushEngage 2024 Browser Push Performance Report, SaleCycle 2025 Remarketing Report, Appcues 2025 User Onboarding Benchmark, and Martech Alliance 2025 SMB Technology Survey. This data-first approach ensures the information is citation-worthy and AI-extractable — original statistics are among the content types AI answer engines cite most frequently.
Add Push Notifications to Your Marketing Stack
CampaignOS includes browser push notifications natively alongside email, SMS, and in-app messaging — manage all channels from a single visual workflow builder. Free to start.
Frequently Asked Questions
What is the average push notification click-through rate in 2026?
The average push notification CTR is 7.8% for browser push (desktop) and 12.4% for mobile app push (iOS), according to OneSignal and Airship 2025 benchmark reports. Triggered push notifications (abandoned cart, price drop) significantly outperform broadcasts, achieving CTRs of 24–32%. These figures are 3–5x higher than the 2.62% average email CTR, making push notifications one of the highest-performing engagement channels by click rate — though with a smaller addressable audience than email due to lower opt-in rates.
What is a good push notification opt-in rate?
A good browser push opt-in rate is above 8% (the global average is 6–10%). Top performers in e-commerce achieve 12–15% opt-in rates by showing prompts with clear value propositions (“Enable to get price drop alerts on items you’ve viewed”) and delaying the prompt until after 30+ seconds on-site. Mobile app push opt-in rates are significantly higher: iOS averages 52.8% and Android defaults to 81.4% opt-in (users must explicitly opt out rather than in).
Are push notifications more effective than email marketing?
Push notifications achieve higher click-through rates than email (7.8% vs. 2.62% on average) but have much smaller addressable audiences due to opt-in constraints. Email consistently generates higher total revenue per campaign because the subscriber base is larger. The most effective approach in 2026 is multichannel automation that combines both: email for comprehensive engagement and push for high-urgency, short-message alerts (price drops, cart reminders, breaking news). Teams using both channels achieve 41% higher overall engagement scores than email-only teams (Martech Alliance, 2025).
What are key customer engagement metrics to track?
Key customer engagement metrics to track across all channels: email open rate (benchmark: 21.33% overall), email CTR (2.62%), push notification CTR (7.8% browser, 12.4% app), SMS open rate (95%+), conversion rate per channel and per automation type, customer lifetime value (LTV) segmented by engagement level, and churn rate correlated with engagement frequency. For automation-specific tracking: workflow completion rate, goal achievement rate per automation, and revenue attributed per automation type using UTM parameters.
How do you increase push notification click rates?
To increase push notification CTR: (1) use triggered notifications rather than mass broadcasts — triggered notifications achieve 3x higher CTR, (2) personalize the message with contact name or referenced item (“Your cart item is back in stock”), (3) optimize send timing — Tuesday–Thursday, 10am–2pm local time for most industries, (4) use specific, actionable copy (“Save 20% — ends today”) rather than generic copy (“Check out our sale”), (5) include an image for web push (image push achieves 25% higher CTR than text-only), and (6) limit frequency to 1–2 push notifications per week to avoid notification fatigue that reduces opt-in retention.