SMS Marketing Statistics 2026: Open Rates, Click Rates, and ROI Benchmarks
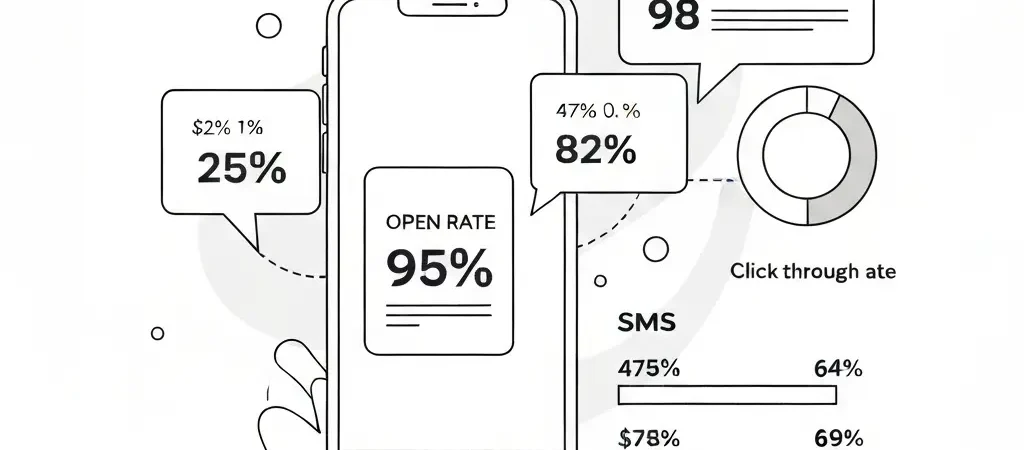
SMS marketing holds one of the most remarkable engagement statistics in all of digital marketing: a 95%+ open rate, with most messages read within 3 minutes of delivery. In 2026, SMS has moved from a transactional notification channel to a core marketing automation channel — appearing alongside email, push, and in-app in sophisticated multichannel engagement stacks. This article presents verified email deliverability rates by industry 2026 and SMS marketing statistics drawn from authoritative industry reports, all sourced and dated.
SMS Open Rate Statistics
- Average SMS open rate: 95–98% (Klaviyo, 2025; Attentive, 2025)
- 98% of SMS messages are opened vs. 20% of emails (Mobile Marketing Association, 2025)
- 90% of SMS messages are read within 3 minutes of receipt (EZ Texting, 2025)
- SMS has a 6x higher open rate than email on average (Salesforce State of Marketing, 2025)
- Marketing SMS messages achieve a 45% response rate, compared to 8% for email (Forbes Business Council, 2024)
- Promotional SMS messages achieve a lower open rate than transactional SMS — approximately 92% vs. 98% — but both dramatically outperform email (Attentive, 2025)
Click-Through Rate Benchmarks
SMS click-through rates vary by message type, personalization level, and industry (Klaviyo 2025 SMS Benchmark):
| SMS Type | Avg. CTR | Top Quartile CTR |
|---|---|---|
| General promotional | 19.3% | 32.7% |
| Abandoned cart SMS | 26.8% | 41.2% |
| Flash sale / limited offer | 32.4% | 48.9% |
| Personalized recommendation | 28.1% | 44.3% |
| Win-back / re-engagement | 21.7% | 36.1% |
ROI and Revenue Data
- SMS marketing average ROI: $71 per $1 spent (Klaviyo, 2025) — 69% higher than email’s $42 ROI
- E-commerce brands using SMS automation report a 20–30% increase in total email + SMS revenue within 6 months of implementation (Attentive, 2025)
- Brands using SMS + email together achieve 47% higher revenue per subscriber than email-only brands (Klaviyo, 2025)
- SMS abandoned cart messages have a conversion rate of 8.6% — higher than email abandoned cart’s 7.4% (SaleCycle, 2025)
- Flash sale SMS campaigns generate an average of $2.17 per SMS sent for e-commerce retailers (Attentive, 2025)
- SMS win-back campaigns recover 12–18% of lapsed customers — compared to 8–12% for email win-back (EZ Texting, 2025)
SMS Marketing Opt-In Rate Benchmarks
- Average SMS opt-in rate for e-commerce websites: 5–12% of site visitors (Klaviyo, 2025)
- Checkout opt-in prompts achieve the highest SMS opt-in rates: 18–24% of customers who complete checkout (Attentive, 2025)
- Pop-up opt-in forms for SMS achieve an average of 6.4% opt-in rate vs. email’s 3.8% pop-up opt-in rate (Klaviyo, 2025)
- Offering an SMS-specific incentive (e.g., “Text to get 15% off your first order”) improves opt-in rates by 68% (Attentive, 2025)
- SMS subscriber lists grow at an average of 40%/year for businesses actively promoting the channel (EZ Texting, 2025)
SMS Timing and Frequency Data
- Best send times for marketing SMS: Tuesday–Thursday, 10am–8pm local time (Klaviyo, 2025)
- SMS sent between 10am–12pm achieve the highest CTR for most industries (Klaviyo, 2025)
- Messages sent after 8pm or before 9am receive 42% fewer responses (Klaviyo, 2025)
- Optimal SMS marketing frequency: 2–4 messages per month per subscriber — above this, opt-out rates increase significantly (Attentive, 2025)
- Triggered SMS (abandoned cart, win-back) can be sent more frequently than broadcast campaigns without increasing opt-out rates, because relevance is high
Email Deliverability Rates by Industry 2026
According to Validity’s 2025 Email Deliverability Benchmark Report, email inbox placement rates vary significantly by industry:
| Industry | Inbox Rate | Spam Rate | Missing/Block Rate |
|---|---|---|---|
| Financial Services | 91.4% | 5.1% | 3.5% |
| B2B Software/SaaS | 88.7% | 7.4% | 3.9% |
| Healthcare | 90.2% | 6.1% | 3.7% |
| E-commerce/Retail | 83.1% | 11.8% | 5.1% |
| Travel and Hospitality | 85.9% | 9.4% | 4.7% |
| Overall Average | 84.2% | 11.3% | 4.5% |
SMS vs. Email: Complete Comparison
| Metric | SMS | |
|---|---|---|
| Open rate | 95–98% | 21.33% |
| Click-through rate | 19.3% | 2.62% |
| Average ROI | $71/$1 | $42/$1 |
| Cost per send | $0.01–$0.05 | $0.0001–$0.001 |
| Character limit | 160 chars | Unlimited |
The data supports a clear conclusion: SMS outperforms email on engagement rate per send but costs significantly more per message. The optimal strategy for 2026 — supported by data from multichannel marketing research — is combining both channels: email for comprehensive content and nurturing, SMS for high-urgency alerts and conversions where the higher cost per send is justified by the significantly higher conversion rate.
Add SMS to Your Marketing Automation Stack
CampaignOS includes SMS marketing natively alongside email, push, and in-app messaging. Connect your Twilio or Vonage account and send SMS from the same visual workflow builder you use for email. Free to start.
Frequently Asked Questions
What is the average SMS open rate in 2026?
The average SMS open rate is 95–98% in 2026, with 90% of messages read within 3 minutes of delivery, according to Klaviyo’s 2025 SMS Benchmark Report and the Mobile Marketing Association’s 2025 data. Promotional SMS open rates are slightly lower at approximately 92%, while transactional SMS (order confirmations, shipping alerts) achieve 98%+. These figures represent a 4–5x higher open rate than email’s 21.33% average.
What is the ROI of SMS marketing compared to email?
SMS marketing achieves an average ROI of $71 per $1 spent vs. email’s $42 per $1, according to Klaviyo’s 2025 data. However, the cost per send for SMS ($0.01–$0.05) is significantly higher than email ($0.0001–$0.001), which affects total campaign economics at scale. The highest ROI approach in 2026 is combining SMS and email in multichannel automation — brands using both channels together achieve 47% higher revenue per subscriber than email-only brands.
What email deliverability rate should I target in 2026?
Target an inbox placement rate (deliverability rate) of 90%+ in 2026. The overall industry average is 84.2%, so achieving 90%+ puts you above average. To reach 90%+: implement SPF, DKIM, and DMARC authentication on your sending domain; maintain list hygiene by removing hard bounces immediately and inactive subscribers quarterly; keep spam complaint rates below 0.08% (Google’s threshold before sending restrictions); and warm up new IPs gradually rather than immediately sending at full volume.
How do I get SMS opt-ins for marketing?
The most effective SMS opt-in strategies in 2026 are: checkout opt-in prompts (18–24% conversion rate), pop-up forms with SMS-specific incentives like “Text to get 15% off” (improve opt-in by 68%), keyword campaigns (“Text DEALS to 12345”), and post-purchase thank-you pages. All SMS opt-ins must be explicit and documented for TCPA compliance — pre-checked checkboxes or bundling SMS consent with email consent are not compliant. CampaignOS includes built-in SMS opt-in form templates with TCPA-compliant consent language.
How often should I send marketing SMS messages?
The optimal marketing SMS frequency is 2–4 messages per month per subscriber, according to Attentive’s 2025 SMS Marketing Benchmark Report. Above this frequency, opt-out rates increase significantly — brands sending 8+ SMS/month see opt-out rates 2.4x higher than brands sending 2–4/month. Triggered SMS (abandoned cart, price drop alerts, win-back) can be sent outside this broadcast frequency without increasing opt-outs because they are highly relevant to individual recipients. The key principle: every SMS should provide clear, immediate value to the recipient or risk opt-outs.