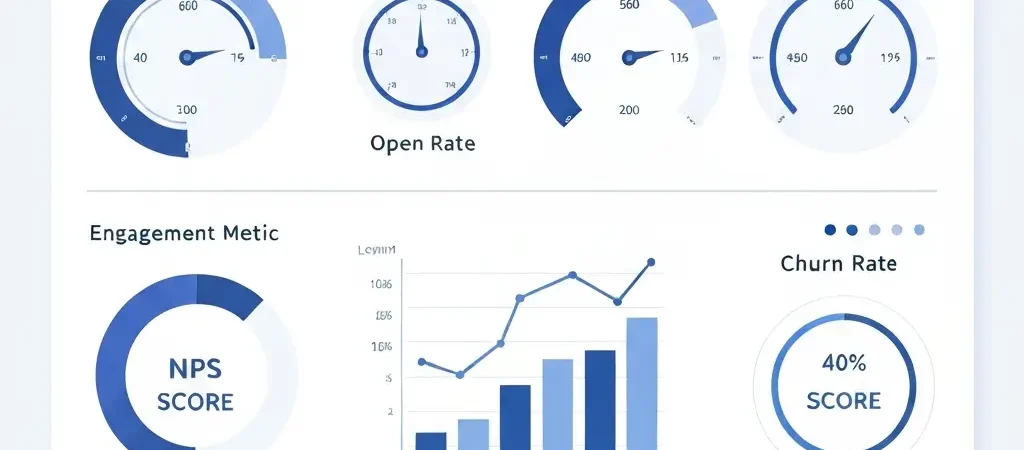
Customer Engagement Metrics & Benchmarks 2026: 50+ Data Points for Marketers
Most marketing teams track customer engagement metrics — but few have a clear picture of what good actually looks like. If your email open rate is 19%, is that a problem or par for the course? If your NPS is 42, are you outperforming your industry? Without reliable benchmarks, customer engagement metrics are just numbers without context. This guide changes that. We’ve compiled 50+ data points across email, mobile, social, omnichannel, and loyalty — with industry-specific breakdowns — so you can set targets that are ambitious and realistic in 2026.
Understanding customer engagement metrics and benchmarks has become more urgent as marketing channels multiply and attention spans shrink. Platforms that aggregate engagement data across channels now show that 73% of consumers use multiple channels during their buying journey (Salesforce State of the Connected Customer, 2025). Yet most measurement frameworks were built for a single-channel world. This guide bridges that gap with current data, methodology, and tool recommendations.
Why Engagement Benchmarks Matter in 2026
Setting KPIs without benchmarks is like setting a race time goal without knowing the course. Customer engagement benchmarks serve three practical functions:
- Calibration: They tell you whether your current performance is a problem or an asset relative to competitors.
- Goal-setting: They give you a data-backed ceiling and floor for stretch vs. baseline targets.
- Prioritization: They reveal which channels have the highest upside if improved by even a few percentage points.
A 2025 Gartner study found that marketing teams that track engagement KPIs against industry benchmarks are 2.1x more likely to exceed revenue targets than those that set targets in isolation. The gap between top-quartile and bottom-quartile performers on engagement metrics typically corresponds to a 30–45% difference in customer lifetime value.
Benchmarks also change. Apple’s Mail Privacy Protection, launched in iOS 15 and now adopted by over 55% of email clients globally, inflated open rate statistics significantly. Any benchmark data from before 2022 that cites open rates without accounting for MPP should be treated with caution.
For more context on the broader marketing automation landscape, see our Marketing Automation Statistics 2026: 60+ Data Points on ROI, Adoption, and Revenue and our detailed Email Marketing ROI Benchmarks by Industry report.
Email Engagement Benchmarks by Industry
Email remains the highest-ROI digital marketing channel, returning an average of $36–42 for every $1 spent (DMA, Litmus 2025). But average returns mask enormous variation by industry, list quality, and sending frequency.
Open Rate Benchmarks (2026)
Note: All open rates below are “privacy-adjusted” estimates that attempt to filter out Apple MPP auto-opens, using click-to-open rate (CTOR) modeling and device-segmented data.
| Industry | Avg Open Rate | Top Quartile | Bottom Quartile |
|---|---|---|---|
| Government / Nonprofit | 28.7% | 38.2% | 19.1% |
| Education | 27.4% | 36.5% | 18.3% |
| B2B / Professional Services | 23.9% | 32.1% | 15.8% |
| Healthcare | 23.1% | 31.4% | 14.9% |
| Finance & Insurance | 22.0% | 29.7% | 14.2% |
| SaaS / Technology | 21.7% | 29.3% | 13.9% |
| Media & Publishing | 20.9% | 28.1% | 13.0% |
| Retail / E-commerce | 17.8% | 24.5% | 11.2% |
| Travel & Hospitality | 16.4% | 22.8% | 10.1% |
| All Industries (Average) | 21.5% | 29.0% | 13.6% |
Click-Through Rate (CTR) and CTOR Benchmarks
| Industry | Avg CTR | Avg CTOR | Avg Unsubscribe Rate |
|---|---|---|---|
| B2B / Professional Services | 3.2% | 13.4% | 0.18% |
| SaaS / Technology | 2.8% | 12.9% | 0.20% |
| Retail / E-commerce | 2.1% | 11.8% | 0.22% |
| Finance & Insurance | 2.5% | 11.4% | 0.14% |
| Travel & Hospitality | 1.8% | 10.9% | 0.25% |
| All Industries (Average) | 2.3% | 11.9% | 0.21% |
A CTOR (click-to-open rate) above 15% is considered strong across most industries. CTOR is a better signal of content relevance than CTR alone, because it filters out subscribers who never opened the email.
Mobile & Push Notification Benchmarks
Mobile push notifications have become a critical engagement channel as smartphone penetration exceeds 85% in most developed markets. However, they require careful calibration — too many sends and opt-out rates spike.
| Metric | iOS Average | Android Average | Top Quartile |
|---|---|---|---|
| Push opt-in rate | 51% | 81% | 68% / 89% |
| Push CTR (direct open rate) | 3.4% | 4.1% | 7.8% |
| In-app message CTR | 8.0% | 8.4% | 14.5% |
| SMS open rate | 97% | 97% | — |
| SMS CTR | 19–36% | 19–36% | 45%+ |
| App uninstall rate (30-day) | 25% | 28% | <10% |
Sources: Braze 2025 Global Engagement Report, CleverTap Benchmark Report 2025, Attentive SMS Benchmark Report 2025.
Social Media Engagement Rate Benchmarks
Social media engagement rates have declined steadily as organic reach narrows. Brands relying on organic social for acquisition in 2026 face a harder environment than even two years ago — but engagement from existing followers remains a strong loyalty signal.
| Platform | Average Engagement Rate | Good Rate | Excellent Rate |
|---|---|---|---|
| Instagram (posts) | 0.60% | 1–3% | 3%+ |
| Instagram (Reels) | 1.48% | 2–5% | 5%+ |
| 3.16% | 3–6% | 6%+ | |
| Facebook (pages) | 0.07% | 0.2–1% | 1%+ |
| TikTok | 5.1% | 5–9% | 9%+ |
| X / Twitter | 0.04% | 0.1–0.5% | 0.5%+ |
Source: Rival IQ Social Media Industry Benchmark Report 2026, Sprout Social Index 2025.
LinkedIn remains the strongest B2B social engagement channel. If you are running B2B campaigns, a LinkedIn engagement rate above 3% paired with email nurture sequences is the most efficient combination for pipeline acceleration in 2026.
Customer Retention and Churn Benchmarks
Retention is the engagement metric that directly maps to revenue. A 5% increase in customer retention increases profits by 25–95% (Bain & Company), making it the most leveraged metric in this guide.
Annual Churn Rate Benchmarks by Business Model
| Business Model | Average Annual Churn | Best-in-Class | At-Risk Threshold |
|---|---|---|---|
| Enterprise SaaS | 6–10% | <5% | >15% |
| SMB SaaS | 18–24% | <10% | >35% |
| E-commerce (subscription) | 20–30% | <15% | >40% |
| Media / Newsletter | 12–20% | <8% | >30% |
| Consumer Apps | 35–60% | <20% | >70% |
| Telecom | 15–25% | <10% | >35% |
Repeat Purchase Rate Benchmarks (E-commerce)
| Category | Avg Repeat Purchase Rate | Top Quartile |
|---|---|---|
| Beauty & Personal Care | 38% | 52% |
| Health & Wellness | 34% | 49% |
| Apparel & Fashion | 26% | 40% |
| Home & Garden | 22% | 34% |
| Electronics | 14% | 24% |
NPS and CSAT Benchmarks by Industry
Net Promoter Score (NPS) is the most widely used loyalty metric globally, with over 65% of Fortune 1000 companies tracking it as a primary KPI (Bain 2025). Customer Satisfaction Score (CSAT) complements NPS by measuring satisfaction at specific touchpoints rather than overall loyalty.
NPS Benchmarks by Industry (2026)
| Industry | Average NPS | Top 25% | Bottom 25% |
|---|---|---|---|
| Software / SaaS | 41 | 62 | 18 |
| Retail | 44 | 65 | 20 |
| Healthcare | 27 | 48 | 8 |
| Financial Services | 34 | 55 | 12 |
| Telecom | 24 | 41 | 5 |
| E-commerce | 45 | 67 | 21 |
| Travel & Hospitality | 39 | 58 | 14 |
| All Industries (Average) | 32 | 52 | 11 |
CSAT Benchmarks
CSAT is measured on a 1–5 or 1–10 scale, with scores typically expressed as a percentage of respondents rating 4 or 5 (on a 5-point scale). Global averages:
- Software / SaaS: 78% positive CSAT (good: 80%+, excellent: 90%+)
- E-commerce: 80% positive CSAT
- Healthcare: 74% positive CSAT
- Financial Services: 72% positive CSAT
- Telecom: 66% positive CSAT (lowest of any major sector)
Customer Effort Score (CES) is increasingly replacing CSAT for support interactions. A CES of 5.5+ on a 7-point scale is considered strong, with the top 10% of support teams achieving 6.2+.
CLV and ARPU Benchmarks
Customer Lifetime Value (CLV) and Average Revenue Per User (ARPU) are the financial backbone of engagement strategy. High engagement correlates directly with CLV expansion — engaged customers spend 23% more over their lifetime (Gallup 2025).
CLV-to-CAC Ratio Benchmarks
| Business Stage | Minimum Healthy Ratio | Good Ratio | Excellent Ratio |
|---|---|---|---|
| Early-stage startup | 1:1 | 2:1 | 3:1+ |
| Growth-stage SaaS | 3:1 | 5:1 | 7:1+ |
| Mature SaaS | 3:1 | 5:1 | 8:1+ |
| E-commerce | 2:1 | 3:1 | 5:1+ |
A CLV:CAC ratio below 3:1 in SaaS typically signals unsustainable growth, while ratios above 5:1 may indicate under-investment in customer acquisition. The benchmark most investors cite as the “Goldilocks zone” is 3:1–5:1.
Omnichannel Engagement Data
The most important trend in customer engagement metrics in 2026 is the omnichannel premium — the measurable lift that comes from coordinating engagement across channels rather than treating them in isolation.
Key Omnichannel Benchmarks
- Customers engaged across 3+ channels have an 89% higher retention rate than single-channel customers (Omnisend 2025)
- Omnichannel campaigns achieve 287% higher purchase rates compared to single-channel campaigns
- Companies with strong omnichannel engagement strategies retain 91% of their customers year-over-year vs. 33% for companies with weak strategies
- Average order value is 13% higher for omnichannel customers
- Omnichannel shoppers visit a brand’s website 2.3x more than single-channel shoppers
- B2B buyers now use an average of 10 channels during their purchase journey (Gartner 2025)
- Only 14% of organizations report having fully implemented an omnichannel engagement strategy
See our full analysis of omnichannel architecture in What Is Omnichannel Marketing Automation?.
Channel Mix Benchmarks for High-Engagement Brands
| Channel Combination | Avg Retention Lift vs. Email Only | Avg Revenue Lift |
|---|---|---|
| Email + SMS | +47% | +28% |
| Email + Push | +38% | +22% |
| Email + SMS + Push | +89% | +51% |
| Email + SMS + Push + Social | +112% | +67% |
Building an Engagement Scoring Methodology
Raw metrics answer “what happened.” Engagement scores answer “who is at risk?” and “who is ready to buy?” Building a scoring model requires three decisions: which signals to include, how to weight them, and what threshold triggers action.
Step 1: Select Your Engagement Signals
Typical signals by channel:
- Email: Opens (+2pts), clicks (+5pts), forwards (+8pts), replies (+10pts), unsubscribes (−20pts)
- Product: Logins (+3pts), feature usage (+5pts), dashboard views (+2pts), admin actions (+10pts)
- Support: Ticket opened (−5pts), ticket resolved positively (+8pts), feature request (+7pts)
- Commercial: Purchase (+15pts), upsell acceptance (+20pts), renewal (+25pts), refund (−15pts)
Step 2: Apply Time Decay
Actions from 12 months ago should not carry the same weight as actions from last week. A standard decay function halves point values every 90 days. Most marketing automation platforms — including CampaignOS — let you configure decay schedules per signal type.
Step 3: Define Segments and Thresholds
| Segment | Score Range | Recommended Action |
|---|---|---|
| Champion | 80–100 | Upsell / referral program |
| Engaged | 60–79 | Expansion sequences |
| Neutral | 40–59 | Re-engagement campaigns |
| At Risk | 20–39 | Win-back + CS outreach |
| Churned / Ghost | 0–19 | Sunset / list hygiene |
Putting these scoring models into action requires the right automation infrastructure. For a practical guide to building the workflows that act on these scores, see our email marketing automation complete guide for 2026, which covers how to configure score-triggered sequences step by step. To understand the return on investment these scoring systems deliver in practice, the AI marketing automation ROI statistics for 2026 report compiles 50+ data points on automation investment return across industries.
Tools for Tracking Customer Engagement Metrics
The right platform makes it possible to track all these metrics in one place rather than stitching together dashboards from five different tools. Key categories:
Marketing Automation Platforms (Full-Stack)
- CampaignOS — Open-source, self-hosted, with native email, SMS, push, and engagement scoring. No per-contact pricing. Ideal for brands that want full data ownership and GDPR compliance without vendor lock-in.
- HubSpot Marketing Hub — Full-featured but expensive at scale; Marketing Hub Professional starts at $800/month for 2,000 contacts.
- Klaviyo — Strong for e-commerce, deep Shopify integration, but costs escalate sharply above 50k contacts.
- Braze — Best-in-class for mobile/push at enterprise scale, but pricing is enterprise-only (typically $60k+/year).
Analytics Platforms
- Mixpanel — Best for product engagement metrics (DAU, MAU, feature adoption, funnel analysis)
- Google Analytics 4 — Free, but limited for user-level engagement tracking compared to dedicated product analytics
- Amplitude — Strong behavioral cohort analysis, good for engagement decay modeling
NPS / Survey Tools
- Delighted — Simple NPS, CSAT, and CES collection with Slack/CRM integrations
- Qualtrics XM — Enterprise-grade, but significant implementation overhead
- Hotjar — Combines heatmaps with survey tools for mixed-signal engagement analysis
Frequently Asked Questions
What is a good customer engagement rate in 2026?
A good customer engagement rate varies by channel. For email, an open rate above 25% is considered strong. For social media, an engagement rate of 1–3% is average, while 3–6% is excellent. Mobile push notification CTRs above 5% are considered high-performing. What matters most is comparing against your own historical data and industry-specific benchmarks rather than cross-industry averages.
What are the most important customer engagement metrics to track?
The most critical customer engagement metrics include email open rate, click-through rate (CTR), Customer Lifetime Value (CLV), Net Promoter Score (NPS), churn rate, Monthly Active Users (MAU), and customer retention rate. Together they give a 360-degree view of engagement health across acquisition, activation, retention, and referral stages.
What is the average email open rate benchmark in 2026?
The average email open rate across all industries in 2026 is approximately 21.5% (privacy-adjusted). This varies significantly by industry: B2B emails average 22–24%, e-commerce averages 16–18%, and government/nonprofit sectors frequently exceed 28%. Note that Apple’s Mail Privacy Protection has inflated raw open rates since 2022, so privacy-adjusted or CTOR-based metrics are more reliable.
How do you calculate customer engagement score?
A customer engagement score is calculated by assigning weighted points to specific behavioral actions (email opens, clicks, logins, purchases, support tickets), applying a time-decay function so recent actions count more than old ones, and summing the total over a rolling period. Most marketing automation platforms let you configure custom scoring rules. Thresholds then segment customers into Champion, Engaged, Neutral, At-Risk, and Churned tiers for targeted follow-up.
What is the average churn rate benchmark for SaaS in 2026?
For SaaS companies in 2026, annual churn benchmarks break down by segment: Enterprise SaaS averages 6–10% annually (best-in-class below 5%), while SMB SaaS averages 18–24% annually (best-in-class below 10%). Monthly churn of 2–5% is common at early stages; mature SaaS businesses should target below 1–2% monthly.
What NPS score is considered good in 2026?
An NPS score above 0 means you have more promoters than detractors. Above 50 is excellent, and above 70 is world-class. The average NPS across all industries in 2026 is approximately 32. Technology/SaaS companies average 35–45, while e-commerce averages 44–45. Telecom consistently scores the lowest, averaging around 24.
How does omnichannel engagement affect retention?
Customers engaged across 3+ channels retain at a rate 89% higher than single-channel customers. Companies with strong omnichannel engagement strategies retain 91% of customers year-over-year versus 33% for companies with weak strategies. Omnichannel campaigns also achieve 287% higher purchase rates and 13% higher average order values compared to single-channel approaches.
What tools can I use to track customer engagement metrics?
The most widely used platforms for tracking customer engagement metrics include CampaignOS (open-source, full-stack, self-hosted), HubSpot Marketing Hub (full-featured, expensive at scale), Klaviyo (e-commerce focused), and Braze (enterprise mobile). For product analytics, Mixpanel and Amplitude are the leading choices. For NPS and CSAT, Delighted and Qualtrics are the most common tools.
Ready to Track and Improve Your Engagement Metrics?
CampaignOS gives you the engagement scoring, multichannel automation, and analytics to move from tracking benchmarks to beating them — without paying per-contact fees or surrendering your data to a vendor. Self-hosted, open-source, and built for teams that take data ownership seriously.