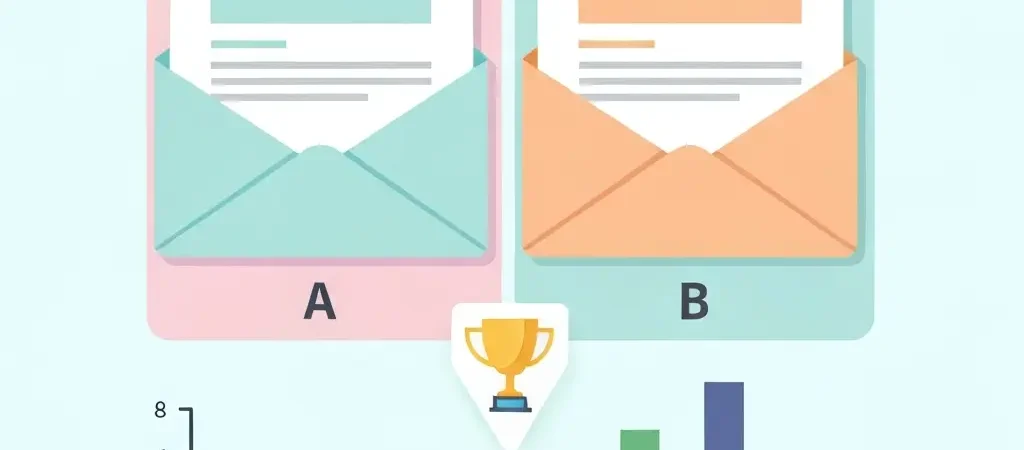
How to Set Up A/B Testing for Email Campaigns Step by Step in 2026
Knowing how to set up A/B testing for email campaigns is what separates marketers who consistently improve from those who run the same campaigns on repeat hoping for different results. A properly executed email A/B test removes guesswork from your most important optimization decisions — subject lines, CTAs, send times, and offer framing — and replaces opinion with evidence. This guide walks through the complete process from hypothesis to scaled winner.
The biggest mistake in email A/B testing is not testing the wrong things — it is testing the right things badly. Undersized samples, too-short test windows, and testing multiple variables simultaneously all produce data that feels meaningful but leads to wrong conclusions. Every step below is designed to prevent exactly that.
Prerequisites and Time Estimate
Difficulty: Beginner
Time to first result: 3–7 days after launch
Minimum list size: 2,000 active subscribers (to run meaningful tests)
What you need:
- An email marketing platform with built-in A/B test functionality (most modern platforms include this)
- A clearly defined primary metric (open rate, click rate, or conversion rate)
- A list segment of active subscribers (opened at least once in last 90 days)
- Access to historical campaign performance data for establishing a baseline
Step 1 — Establish Your Baseline
Before testing anything, you need to know what “normal” looks like for your specific audience and list. Pull your last 10 campaigns and calculate the average for each metric:
- Open rate: Industry average is 21–25% across all sectors. B2B technology averages 22%. E-commerce averages 18–20%.
- Click-through rate (CTR): Industry average is 2–3%. Anything above 4% is strong.
- Click-to-open rate (CTOR): Of people who opened, what percentage clicked? Average is 10–15%.
- Conversion rate: Depends on your goal — purchase, sign-up, download. Establish your current rate before testing.
Write down your baselines. Every future test result is interpreted relative to these numbers, not absolute benchmarks.
Step 2 — Form a Specific Hypothesis
A hypothesis is a falsifiable prediction about what will happen and why. It is what separates a test from an experiment. Use this format:
“If I change [element] from [current version] to [new version], then [metric] will [increase/decrease] because [reason based on audience knowledge or evidence].”
Good hypothesis: “If I change the subject line from a feature-focused format (‘New dashboard update’) to a benefit-focused format (‘See your results faster’), then open rate will increase because our audience responds to outcome-driven messaging.”
Bad hypothesis: “Let’s try a different subject line and see what happens.”
The reason your hypothesis must include a “because” is that the explanation drives your learning. If the test confirms your hypothesis, you learn that benefit-driven subject lines work for your audience. If it does not, you learn your assumption about audience motivation was wrong — which is equally valuable.
Step 3 — Choose What to Test First
Test high-impact, low-effort variables first. This hierarchy gives you the fastest return on testing time:
| Test Variable | Affects | Priority | Typical Lift |
|---|---|---|---|
| Subject line | Open rate | 1 (Test first) | 10–30% |
| Call to action (CTA) | Click rate | 2 | 10–25% |
| Send time / day | Open rate, CTR | 3 | 5–15% |
| Email body / offer | Conversion rate | 4 | 5–20% |
| Preview text | Open rate | 5 | 3–8% |
| From name / sender | Open rate, trust | 6 | 5–20% |
| Email length | CTR, conversion | 7 | 3–10% |
| Personalization token | Open rate, trust | 8 | 3–12% |
One variable per test, always. If you change both the subject line and the CTA, you cannot know which change drove the result. Even if one variant clearly wins, you have learned nothing actionable.
Step 4 — Calculate Your Required Sample Size
Running a test with too few recipients produces results that appear significant but are actually noise. Use these minimum thresholds:
- Subject line test (targeting open rate): Minimum 1,000 recipients per variant for a 95% confidence level with a 5% baseline open rate difference. For most lists, 2,000 total (1,000 per variant) is the practical floor.
- CTA test (targeting click rate): Click rates are lower than open rates, so you need larger samples. Minimum 2,000 per variant, ideally 5,000.
- Conversion test: Conversion rates are typically 1–5%, requiring the largest samples — 5,000–10,000 per variant for reliable results.
If your list is smaller than 2,000 active subscribers, run sequential tests instead: send Version A to your full list this week, Version B next week, then compare. The timing difference introduces a confounding variable, but it is better than an underpowered A/B test.
Step 5 — Create Your Two Variants
Variant A (control) is your current approach — the thing you would send if you were not testing. Variant B (treatment) changes only the one element defined in your hypothesis.
For subject line tests:
- Keep everything else identical: same body copy, same CTA, same images, same send time.
- The two subjects should test meaningfully different approaches, not just minor wording tweaks. “10 tips for email marketing” vs “How we increased email revenue by 40%” is a real test. “10 tips for email marketing” vs “Ten tips for email marketing” is not.
For CTA tests:
- Test button text (action-oriented vs descriptive), button color (high contrast vs brand color), button placement (above fold vs below body copy), or CTA format (button vs text link).
- Change only one of these per test.
For send time tests:
- Split your list randomly. Send Variant A at your current default time, Variant B at the test time, on the same day.
- Or: send identical content two weeks apart at different times and compare open rates. Simpler to set up, but less controlled.
Step 6 — Configure the Test in Your Platform
- In your email platform, create a new A/B test campaign (most platforms label this as “A/B test” or “split test”).
- Select the variable you are testing (most platforms have a dropdown: Subject line / From name / Content / Send time).
- Set the split ratio. For most tests, 50/50 is ideal. If you want to send the winner to a holdout group, use a 40/40/20 split (40% A, 40% B, 20% automatic winner send).
- Select your winning metric. Most platforms offer: unique open rate, unique click rate, or revenue (if e-commerce tracking is connected).
- Set the test duration — the time the platform waits before declaring a winner. Set this to a minimum of 24 hours, ideally 48–72 hours. Do not use 4-hour windows — they capture only the most eager openers and skew results toward morning audiences.
- Verify the random split is applied at the recipient level, not the send-time level.
Step 7 — Run the Test for the Right Duration
Test duration is where most marketers make their biggest mistake — ending tests too early when one variant looks like a leader. Early leaders do not always win.
Minimum test durations by goal:
- Open rate: 48–72 hours. Most opens happen in the first 24 hours, but a full 48–72 hours captures late openers and balances time-zone effects.
- Click rate: 72–96 hours. Clicks trail opens by hours or days.
- Conversion rate: 7 days minimum. Purchases and sign-ups often happen 2–5 days after an email is opened.
Do not declare a winner until:
- The test has run for the minimum duration
- Both variants have reached their minimum sample size
- The winning variant shows at least a 95% confidence level (your platform will display this — look for “statistical significance” or a p-value below 0.05)
Step 8 — Analyze and Interpret Results
When the test concludes, you are looking for three things:
- Was there a statistically significant winner? If confidence is below 95%, the result is inconclusive. Do not apply the “winner” — rerun the test with a larger sample.
- Did the result match your hypothesis? If yes, your understanding of your audience was correct — apply the learning broadly. If no, your assumption was wrong — investigate why before drawing conclusions.
- Was the lift meaningful? A statistically significant 0.2% improvement in open rate is not worth acting on. Focus on tests that produce at least 5–10% relative improvement in your target metric.
Record every test result — win, loss, or inconclusive — in a shared test log. After 10+ tests, patterns emerge: your audience opens more on Tuesdays, they click on benefit-focused CTAs, they ignore emojis in subject lines. This institutional knowledge compounds over time and cannot be derived from any single test.
Step 9 — Apply the Winner and Document the Learning
- Update your email templates, automation workflows, and internal style guide to reflect the winning variant.
- Document the test: hypothesis, variant details, sample size, duration, results, confidence level, and the decision made.
- Share results with your team. A test log that only the email marketer reads does not scale.
- Apply the winning approach to your highest-volume automation workflows first — welcome sequences, lead nurture, abandoned cart — where the improvement compounds across every new contact enrolled.
- Plan your next test. Good A/B testing programs run one test per week or one per send cycle. After you exhaust high-impact variables on broadcast campaigns, move testing into your automation workflows.
Once you have winning subject line and CTA patterns, integrate them into your automated sequences. See the guide on how to build a marketing workflow with automation for integrating test learnings into live workflows and the guide on how to create a welcome email sequence that converts for applying test wins to your highest-volume automation.
A/B Testing Priority Roadmap
Use this 12-week roadmap to build your first complete A/B testing program:
| Weeks | Test Focus | Primary Metric |
|---|---|---|
| 1–2 | Subject line format (feature vs benefit) | Open rate |
| 3–4 | Subject line personalization (with/without first name) | Open rate |
| 5–6 | CTA button text (action vs benefit) | Click rate |
| 7–8 | Send day (Tuesday vs Thursday) | Open rate |
| 9–10 | Email length (short vs long) | Click rate, unsubscribe rate |
| 11–12 | Offer framing (discount vs scarcity vs social proof) | Conversion rate |
Advanced Techniques: Multivariate and Sequential Testing
Multivariate testing tests multiple variables simultaneously using statistical modeling to isolate the effect of each. It requires significantly larger sample sizes (10,000+ per combination) and is most useful for high-traffic transactional emails where you have enough volume to make the math work. Most marketing email lists are too small for true multivariate testing — stick with A/B until you have 50,000+ active subscribers.
Sequential testing is the best approach for smaller lists. Instead of sending both variants simultaneously, you test one approach, then the other in subsequent sends to the same segment. The main limitation is that external factors (news events, seasonality) can influence results. Mitigate this by testing in pairs within the same week where possible.
Both approaches integrate naturally with campaign performance tracking — your test log becomes a source of attribution data when you analyze what drove month-over-month performance improvements.
For deeper context on how marketing automation platforms with built-in A/B testing compare, see our ranking of the best open source marketing automation tools.
Frequently Asked Questions
How many subscribers do I need to run an email A/B test?
You need a minimum of 1,000 recipients per variant (2,000 total) for subject line tests targeting open rate. Click rate and conversion rate tests require larger samples — 2,000–5,000 per variant. If your list is under 2,000 active subscribers, use sequential testing instead of simultaneous A/B testing.
How long should I run an email A/B test?
Run open rate tests for 48–72 hours, click rate tests for 72–96 hours, and conversion rate tests for at least 7 days. Ending tests early — even when one variant has a clear lead — produces unreliable results because early openers skew heavily toward specific audience segments and send times.
What should I A/B test first in email campaigns?
Test your subject line first. Subject lines affect open rate, which is the gateway metric — contacts must open before they can click or convert. Subject line tests are also the fastest to produce clear results because open rates respond within 24–48 hours. After optimizing your subject line approach, move to CTA text and placement, which directly affects click rate.
What does statistical significance mean in an email A/B test?
Statistical significance (typically set at 95% confidence) means there is only a 5% probability that the observed difference between variants happened by chance. Most email platforms calculate this automatically. If your platform shows 95%+ confidence, you can trust the result. Below 95%, the result is inconclusive and you should rerun with a larger sample rather than acting on it.
Can I test more than one element at a time in an email?
No — not in standard A/B testing. Testing two elements simultaneously prevents you from knowing which change caused the result. If you need to test multiple variables, run them as sequential individual tests. True multivariate testing (which isolates each variable statistically) requires lists of 10,000+ active subscribers per combination to produce reliable data.
What metrics should I use to declare a winner in an email A/B test?
Choose your winning metric before the test starts, based on your campaign goal. For awareness campaigns, use open rate. For traffic campaigns, use click rate. For conversion campaigns, use revenue or goal completions. Avoid switching your winning metric after seeing results — that is called “p-hacking” and produces misleading conclusions.
How do I apply A/B test results to my automation workflows?
After a test produces a statistically significant winner, update the corresponding email in your automation workflow to use the winning variant. Test on broadcast campaigns first (higher volume, faster results), then apply learnings to automations. For automation-specific testing, most platforms let you A/B test individual emails within a workflow the same way you test broadcast campaigns.
How often should I run email A/B tests?
Run one test per send cycle — typically one per week for teams sending weekly newsletters. Teams sending less frequently should run a test on every other campaign. The goal is to complete 20–30 tests per year, which is enough to build statistically reliable audience intelligence across all major variables. More than one simultaneous test on the same segment contaminates results.
Run A/B Tests Inside Your Automation Workflows
CampaignOS includes built-in A/B testing for both broadcast campaigns and automation workflows — test subject lines, CTAs, and content blocks within your live sequences without breaking the workflow. Free and self-hosted.